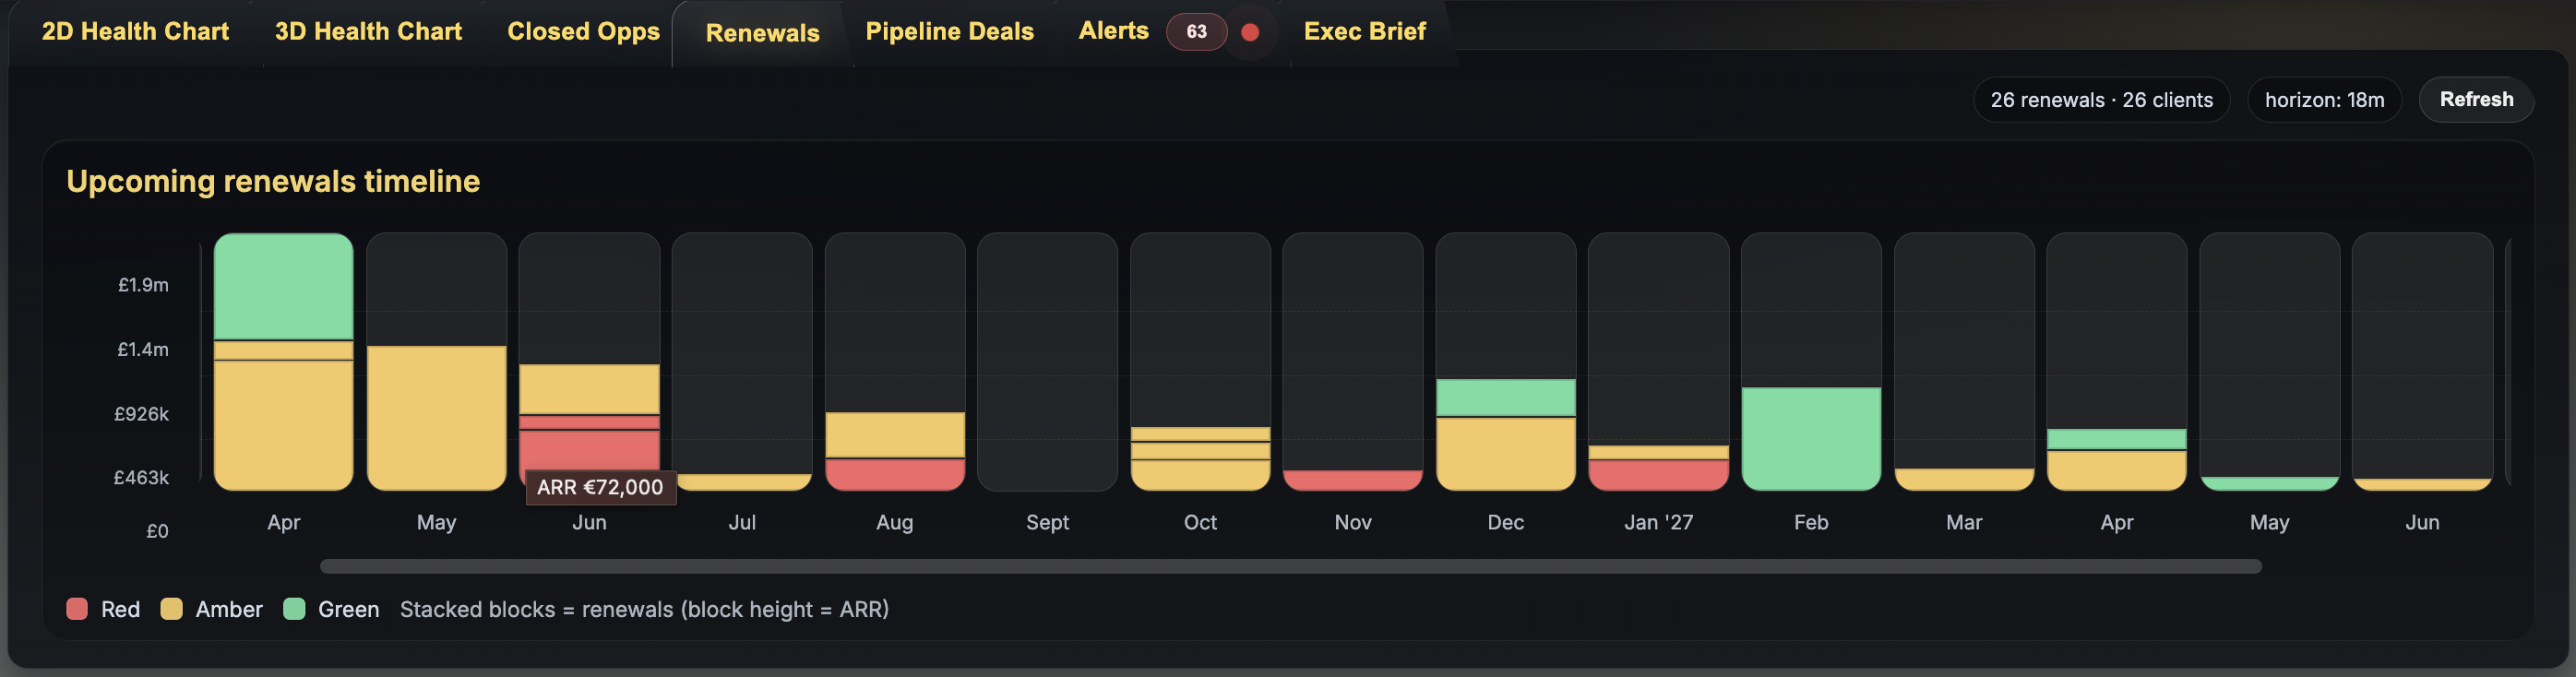
Protect renewals
Be alerted to changes in account health to see where revenue is under pressure.
AI-powered Relationship Management
Proactively turn customer data into clear, explainable actions.
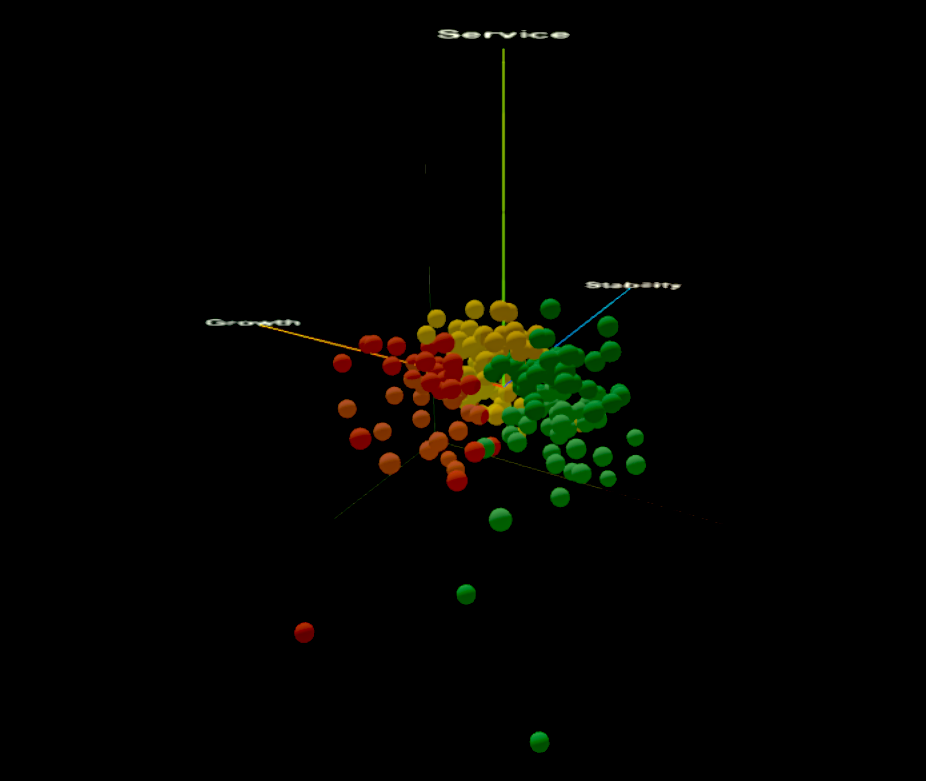
Each point represents a client. Position reveals health and behaviour.
Sagenza takes a scan of your client base and builds a 3D model of your portfolio. Instantly showing where ARR is likely to be retained or lost.
Apply your own benchmarks, weights and business rules to make the model fit how your company actually works
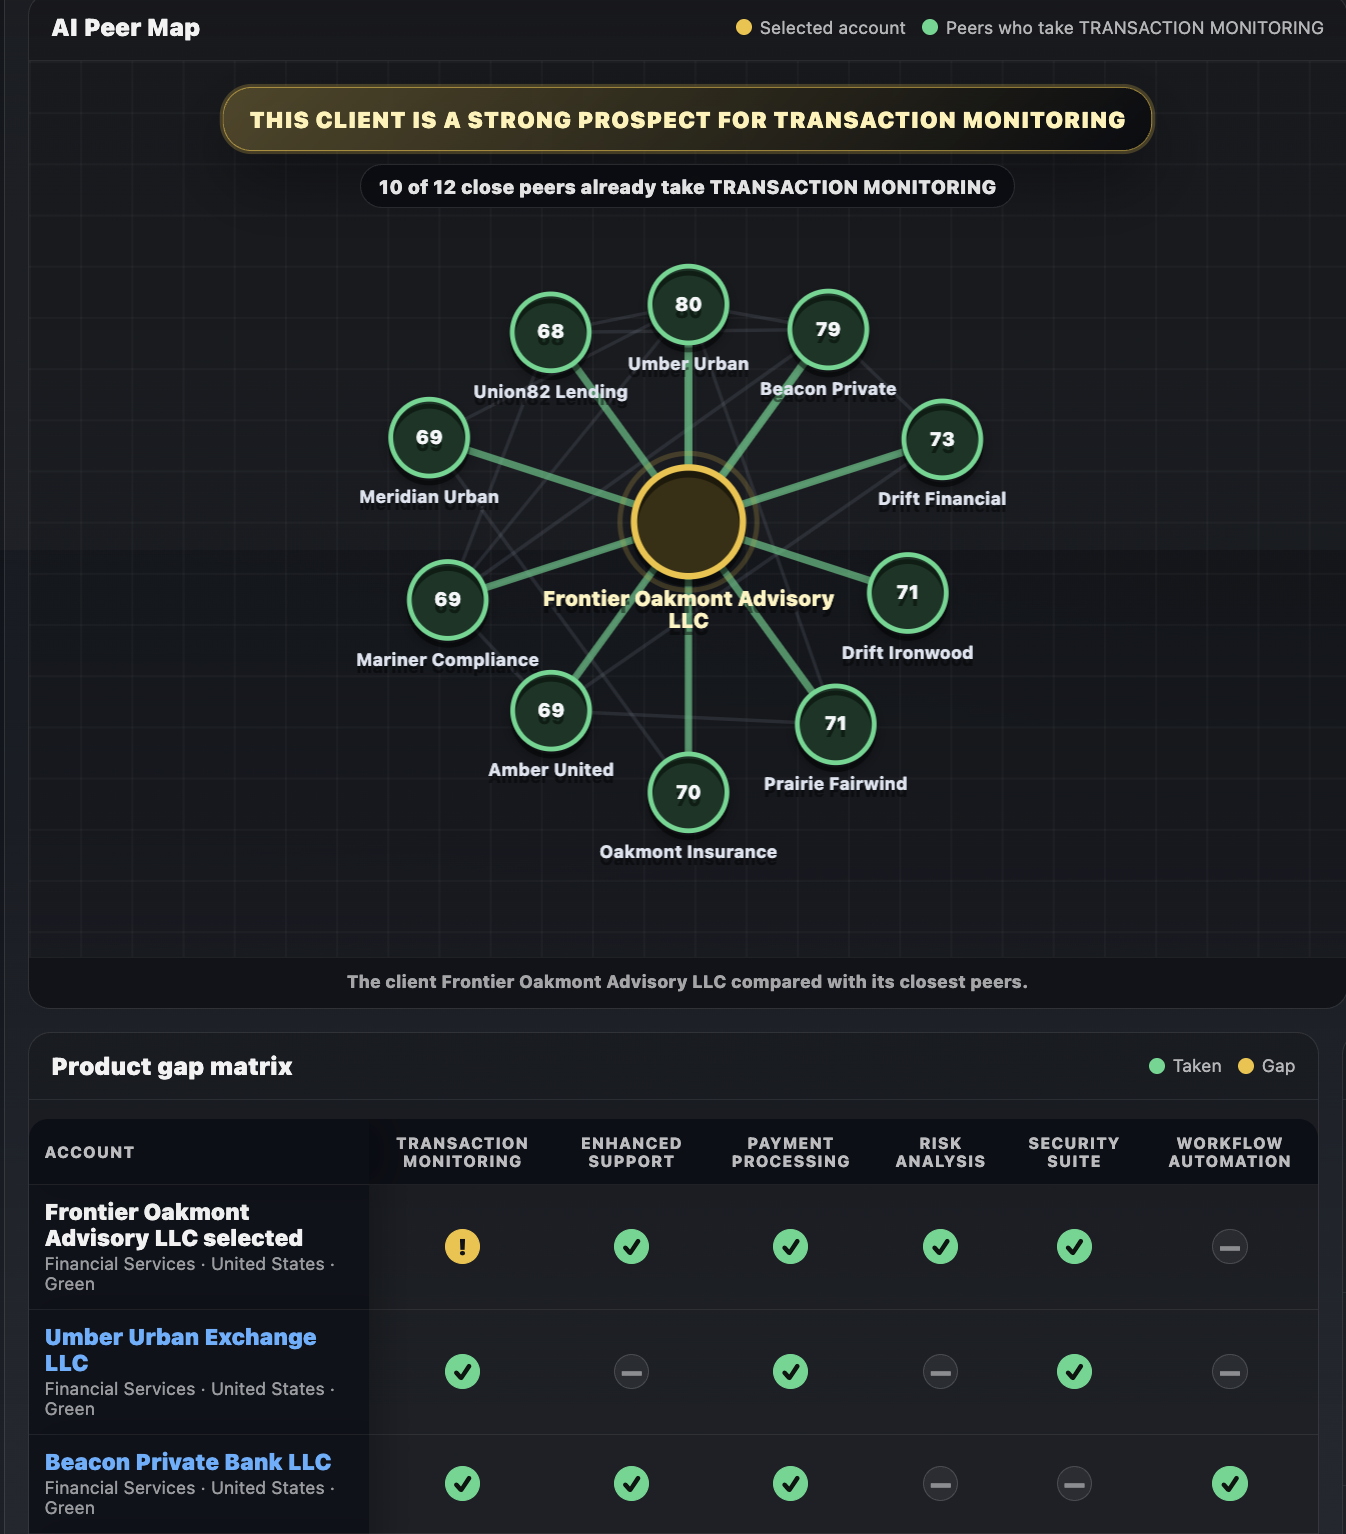
Use AI to identify cross-sell targets by analysing the footprint of similar clients and capture everything with system generated Executive-ready reports.
Customer teams are not short of information. They have health scores, usage trends, support tickets, renewal dates, opportunities, notes and alerts scattered across systems, reports and spreadsheets.
Signals are scattered. Dashboards do not prioritise action. Whitespace does not equal opportunity.
Which clients need attention? Why now? What revenue is at risk? And where is the next credible growth opportunity?
Sagenza helps customer teams move from scattered data and spreadsheet-heavy reporting to clear, prioritised decisions about revenue risk, renewal protection and cross-sell growth.
Be alerted to changes in account health to see where revenue is under pressure.
Turn noisy customer data into clear actions, with explainable recommendations your team can trust.
Identify untaken products that similar customers already buy, turning whitespace into credible sales leads.
Sagenza CRM sits above your support platform, spreadsheets, and operational systems — analysing the (often contrasting) data they already collect and turning it into clear actions. Metrics like Usage, NPS or Support tickets are classified individually and collectively by RAG.
See where cross-selling opportunities are by comparing clients against similar accounts and identifying untaken products with stronger commercial fit.
Explain account movement using clear metric-level evidence, so teams can see which signals are driving risk, momentum, or opportunity.
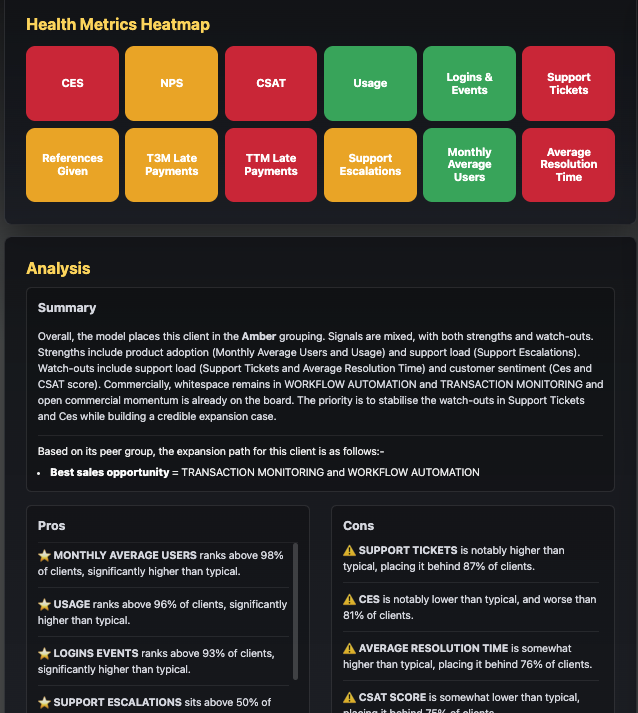
Your Executive team need to know the important details; what is driving change, and where to act first. Sagenza produces a prioritised view of the overall portfolio with clear, traceable explanations your team can actually use.
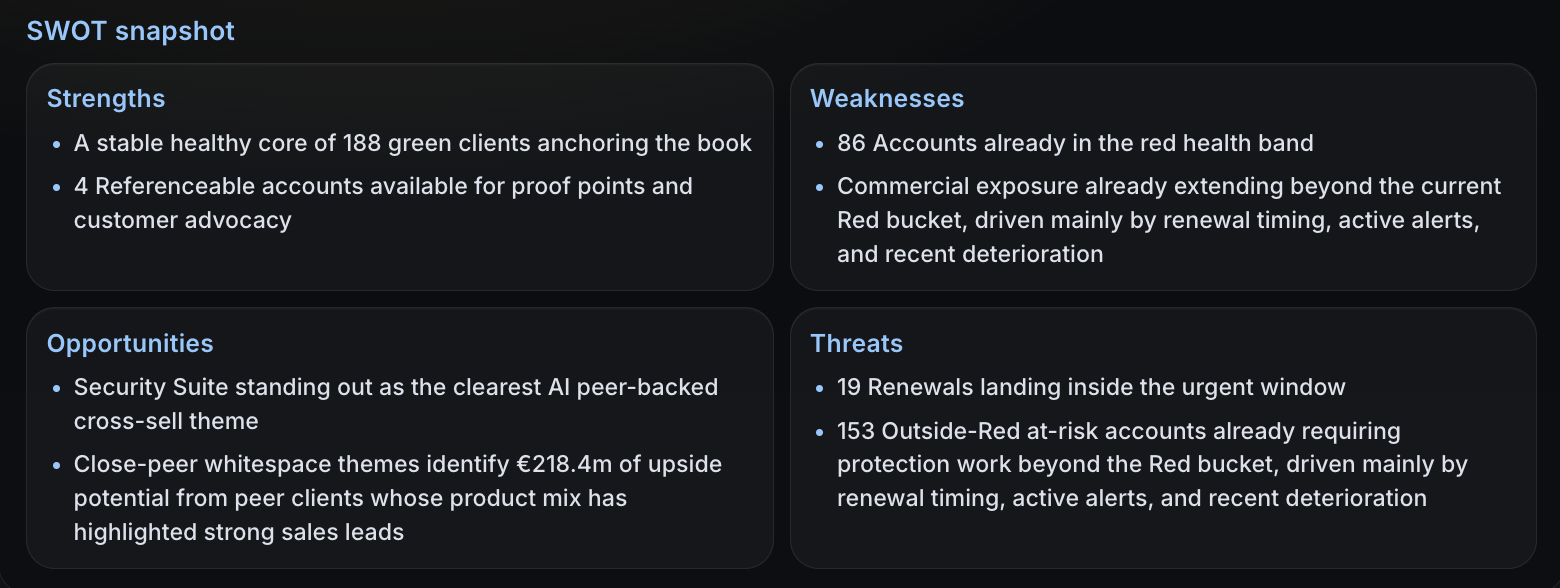
Every insight is grounded in real client data — from usage, engagement, service, operational, and commercial signals already present in your environment. That makes the narrative factual, defensible, and far more useful than gut feel alone.
Traditional CRMs record activity. Sagenza tells you what's changing, which accounts need attention, and where your team should focus next.